Human biology hasn’t changed much in thousands of years, but the way we think about ourselves certainly has, especially when it comes to sexuality. Measured on a historical scale, the scientific pursuit to understand and visualize the range of sexual orientation is a relatively new project that began with pioneers in the 19th century but didn’t pick up serious steam until the mid-20th century. And yet in this short period of time, public attitudes about sex have dramatically evolved. Same-sex attraction is increasingly accepted in many parts of the world, and many folks are recognizing their bisexual attractions. More than that, a growing number of people are coming to appreciate just how complex human sexuality is — as a series of spectrums filled with moving parts, including sexual attractions, romantic attractions, interest (or lack thereof) in sex, identity, aversions, aspirations, and more.
For decades, sex researchers have sought a conceptual scale of sexual orientation that describes human attraction patterns in a holistic way that encompasses not just our turn-ons, but also our turn-offs, motivations, self-perception, and even the crossroads where disgust and arousal can meet.
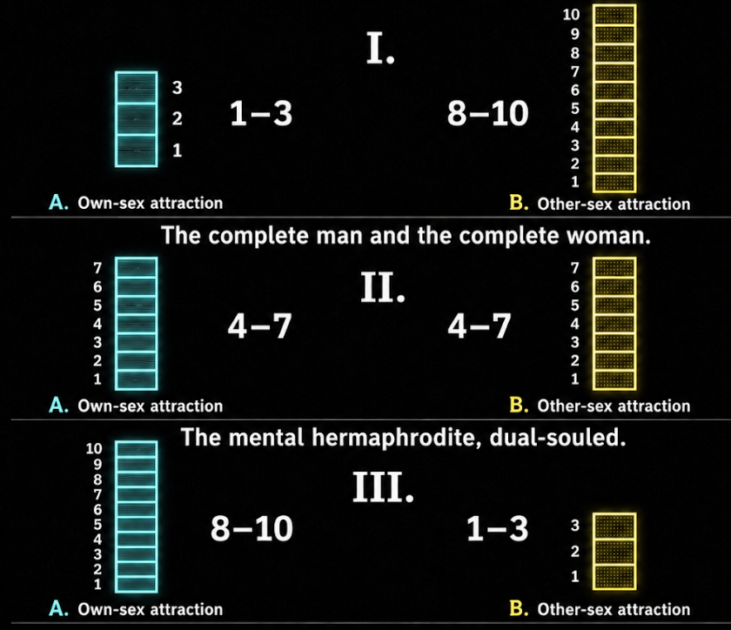
Early on, scientists were primarily concerned with establishing basic concepts. One of the first major attempts at creating a scale of sexual orientation was made by the famed German sexologist and LGBT rights pioneer Magnus Hirschfeld in his 1896 pamphlet Sappho and Socrates. It consisted of two separate scales ranging from 1-10: one scale for same-sex attraction and the other for other-sex attraction. Anyone scoring below 4 in same-sex attraction and above 7 in other-sex attraction, Hirschfeld classified as a “complete man or woman” (in other words, essentially straight). Anyone who scored between 4 and 7 on both scales, he dubbed a “mental hermaphrodite” (what we’d call bisexual today). And those who scored above 7 on same-sex attraction and below 4 on other-sex attraction were “urnings” (in today’s language, gay).
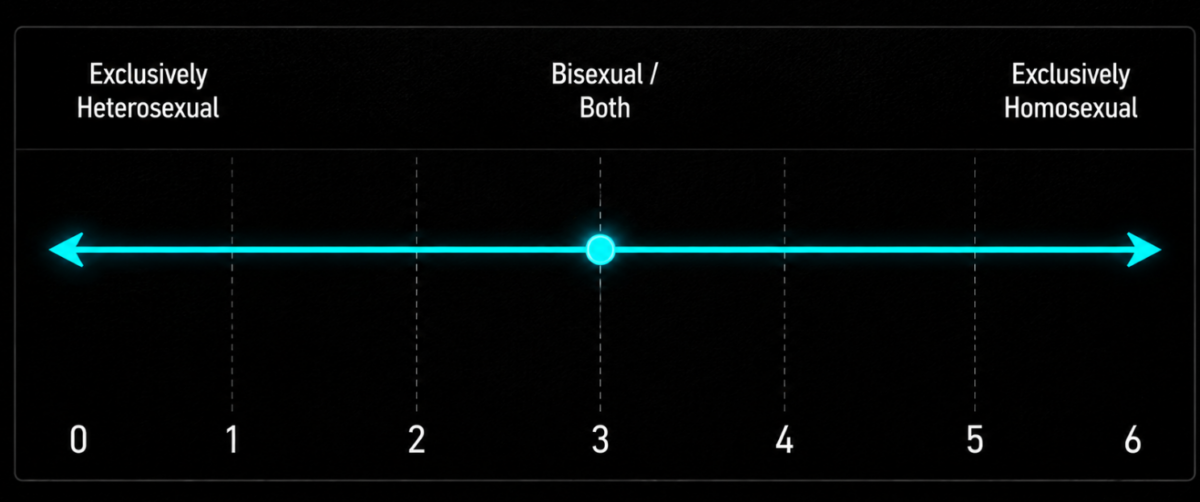
In his groundbreaking book Sexual Behavior in the Human Male (1948), American sex researcher Alfred Kinsey, along with colleagues Wardell Pomeroy and Clyde Martin, introduced a more refined and streamlined version of Hirschfeld’s Scale in what has come to be known as the Kinsey Scale. Using a single scale, Kinsey’s model represents sexual orientation ranging from 0 to 6, where 0 represents exclusive heterosexuality, 6 represents exclusive homosexuality, and 1-5 represents the spectrum of bisexuality. The Kinsey Scale revolutionized the way sexuality was understood among academics and everyday people alike, and remains the most used sexual orientation model to this day.
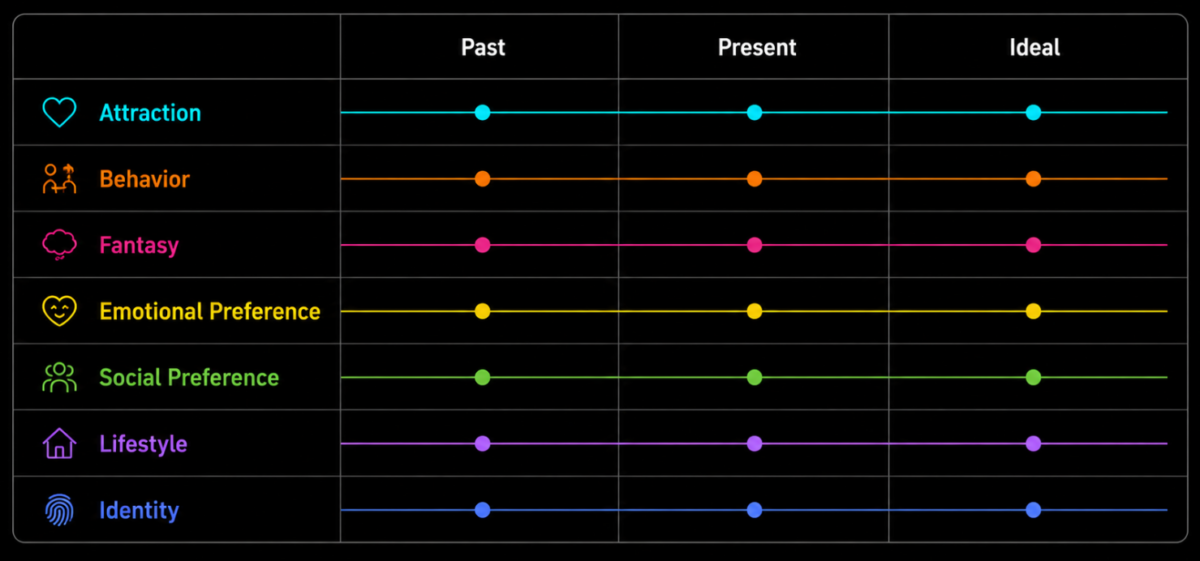
But as helpful as the Kinsey Scale is, it only shows one part of the sexuality spectrum. Building from it, the Austrian-American psychiatrist and sex researcher Fritz Klein introduced the Klein Sexual Orientation Grid in his 1978 book, The Bisexual Option. Designed to give a broader view of sexuality, the Klein grid takes a Kinsey-like scale of 1-7 (instead of 0-6) and applies it to seven different variables: sexual attraction, sexual behavior, sexual fantasies, emotional preference, social preference, heterosexual/homosexual lifestyle, and self-identification, each of which is also broken down by past, present, and ideal future.
Taken together, these give a much more nuanced look at people’s behaviors, motivations, and the ways in which their attractions might shift over time (what the psychologist Lisa Diamond termed “sexual fluidity”). A valuable tool, but still incomplete, and also not the most user-friendly as a visual aid.
Klein wasn’t the only one trying to expand the Kinsey Scale. In 1980, the American psychologist and sex researcher Michael D. Storms went in a somewhat different direction with his Storms Scale. A two-dimensional model with four orientation categories, the Storms Scale represents sexual orientation as a grid containing four boxes: asexuality on the bottom left, heterosexuality on the bottom right, homosexuality on the top left, and bisexuality on the top right. The vertical axis is a sliding scale of homo-eroticism and the horizontal axis is a sliding scale of hetero-eroticism, meaning attraction or desire toward the same or other sex.
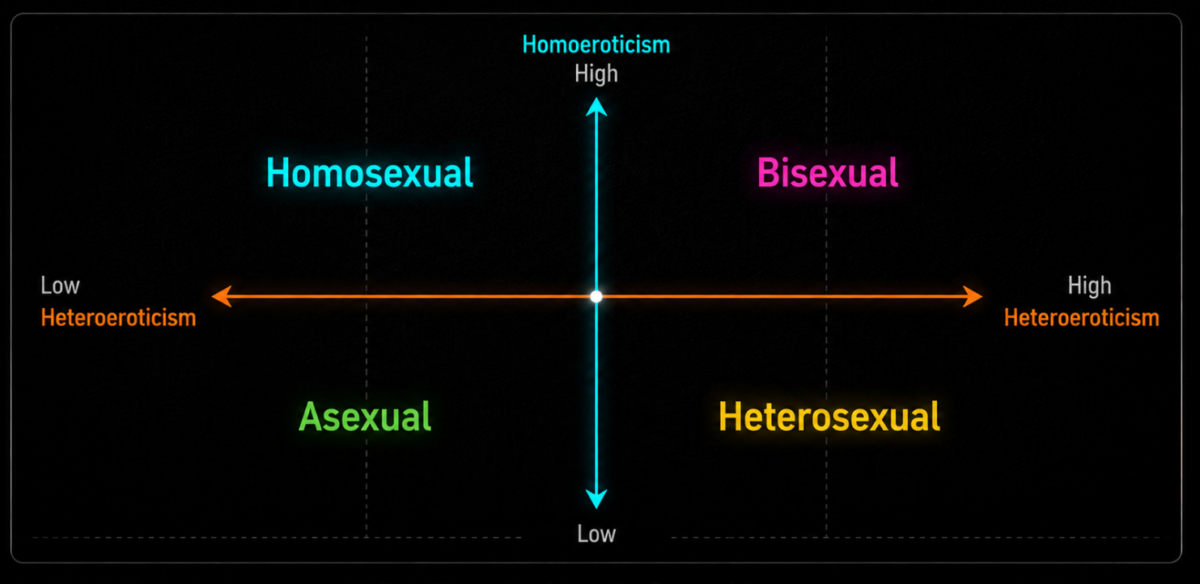
While the Kinsey Scale had an “X” category for people who didn’t report sexual attraction or experience, it sat outside the main scale. Storms, on the other hand, built asexuality directly into the model, making it a visible part of sexual orientation. The Storms model also differentiates same- and other-sex attraction, similar to Hirschfeld’s, but in a more visually digestible way similar to the popular “political compass” quiz. The reason this matters is, as the psychologist A. Lee Beckstead has noted:
If an individual is ‘less homosexual’, it would not necessarily mean he or she is ‘heterosexual’ but may represent asexuality (i.e., an absence of fantasies or attraction for either sex).
In other words, the Storms Scale builds from the Hirschfeld and Kinsey Scales to represent both same- and other-sex attractions by also including the intensity of both attractions.
However, the Storms Scale’s inclusion of these other aspects comes at the cost of accurately describing bisexuality. The Storms Scale sets a pretty high bar for bisexuality: you need moderately high attraction to both sexes just to land on the very edge of the bisexual category. It also appears to require (and reinforce) the stereotype that bi people must necessarily have very intense sexual attractions and/or sex drives. For example, there is no room on this scale for people who are attracted to both sexes but whose level of sexual attraction in general is not high. This is out of step not only with other sexual orientation scales, but with the very definition of bisexuality, which refers to anyone with both heterosexual and homosexual attractions, regardless of the degree of those attractions.
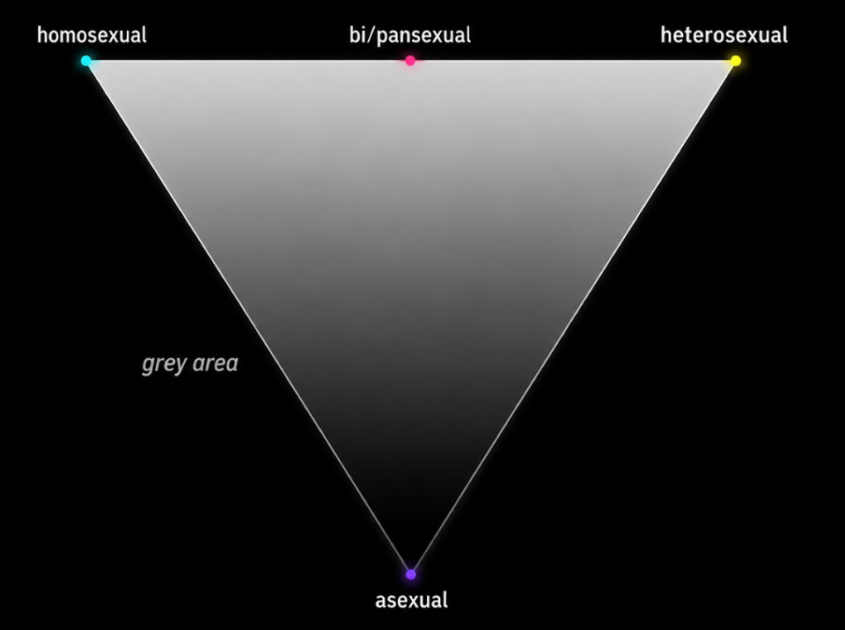
In the 1996 Sell Assessment of Sexual Orientation, American sex researcher Randall Sell attempted to resolve some of the issues with previous scales by including three separate measurements for the gradations of sexual attraction, sexual behavior, and sexual orientation identity — however this really was an assessment tool, not a visual scale. In 2002, a university undergraduate named David Jay added yet another entry: the AVEN triangle. An update on the Kinsey Scale, Jay’s model actually includes asexuality by use of an inverted triangle where the top line represents a rough approximation of the Kinsey Scale and the bottom point represents asexuality. The space in between represents the gradations of sexual desire known as the asexual spectrum. Though a more visually inclusive model than Kinsey’s, the AVEN triangle is an asexual-centric scale that directly centers asexuality and can give the impression that asexuality is more prevalent. This is something of a recurring theme among sexual orientation scales based around asexuality.
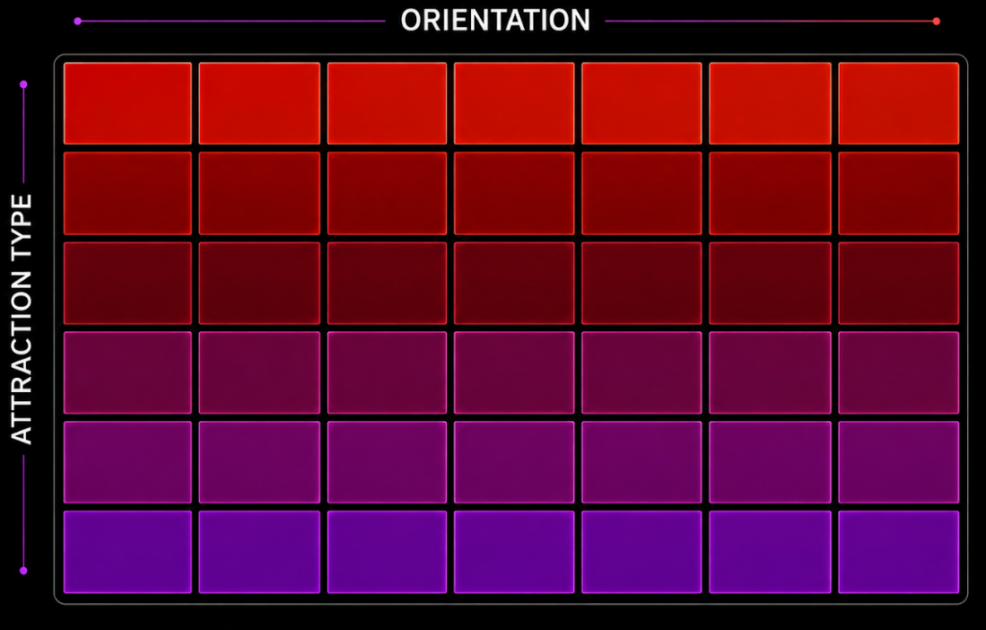
More recently, the Purple-Red Scale began circulating on social media in 2015 and has attracted the attention of both journalists and academics alike. Created by Langdon Parks, the Purple-Red Scale is a two-dimensional grid containing 42 squares, with a horizontal axis representing sexual orientation (similar to the Kinsey Scale) and a vertical axis representing attraction types along the asexuality spectrum. While Purple-Red resolves the bisexuality problem of the Storms Scale, and provides more nuance than the Kinsey Scale or the AVEN triangle, it also carries the same problem as the AVEN triangle: 21 of the 42 squares describe people who experience no sexual attractions. And another 7 describe people who “may develop lustful feelings over the course of a relationship, but not at first”.
This isn’t too surprising considering Parks describes himself as a “heteroromantic asexual”, but it leaves the scale he created, while an interesting contribution to the way we think about human sexuality, very much unrepresentative of the overwhelming majority of humans. According to Ipsos’s 2023 LGBT+ Pride Study Global Survey, just 1% of respondents from the 30 countries polled identified as asexual. Yet on the Purple-Red Scale, those with objectively common sexual desires are visually depicted as being arguably hypersexual.
Each of these approaches, in their own way, provide a useful lens to understand sexuality, but none gives us the whole picture. They mostly leave out one important piece: sexual aversion. As Beckstead wrote:
In general, aversive feelings — subjective or physical — are typically not assessed or accounted for in considering a person’s sexual orientation. […] Given the complexities found in self-reports, I suggest that researchers, clinicians, and lay persons expand their assessment of sexual orientation to include erotic aversion.
One possible sexual orientation scale that has been informally suggested in sexology circles is an iteration of the Storms Scale that extends the vertical and horizontal axes to also include scales of aversion. This configuration would capture sexual aversions, but not in all cases, such as when sexual aversion is jumbled up with sexual attraction to the same thing, as with closeted gay and bi homophobes or people with attractions that are influenced by the perception of taboo and transgression.
Humans are psychologically complicated sexual animals, and for as much as we’ve learned about sexual orientation over the past century and a half, no one has yet found a way to make all the puzzle pieces click together in a holistic and fully satisfying way. One way to address this is by gathering a broader range of data and for future researchers to ask better questions — and more consistent ones. Not just, “Are you straight or gay?” or even, “Are you straight, gay, or bisexual?” but: What is your identity? Who are you attracted to? What have your actual experiences been? And even “experience” needs more detail than a simple body count. Someone’s number of partners may tell one story, while the length and depth of their relationships may tell another. When researchers ask incomplete, different, or non-standardized questions, their results become harder to compare — and we miss a fuller picture of people’s real lives.
As helpful as it would be to have a visualized “grand unified theory” for sexual orientation that makes perfect sense of it all, it may be the case that human sexuality is just too complex and diverse to be neatly represented in all its nuances. What we do know is that there’s “no one way to be bi”. This may be truer than we appreciate — and not just for bi people. Perhaps there are simply too many ways to be sexual (or not so sexual) for us to ever fit on an infographic. But that shouldn’t stop researchers from continuing their quest to push the frontiers of knowledge and understanding.